Welcome to Leisure Village in Camarillo, CA!
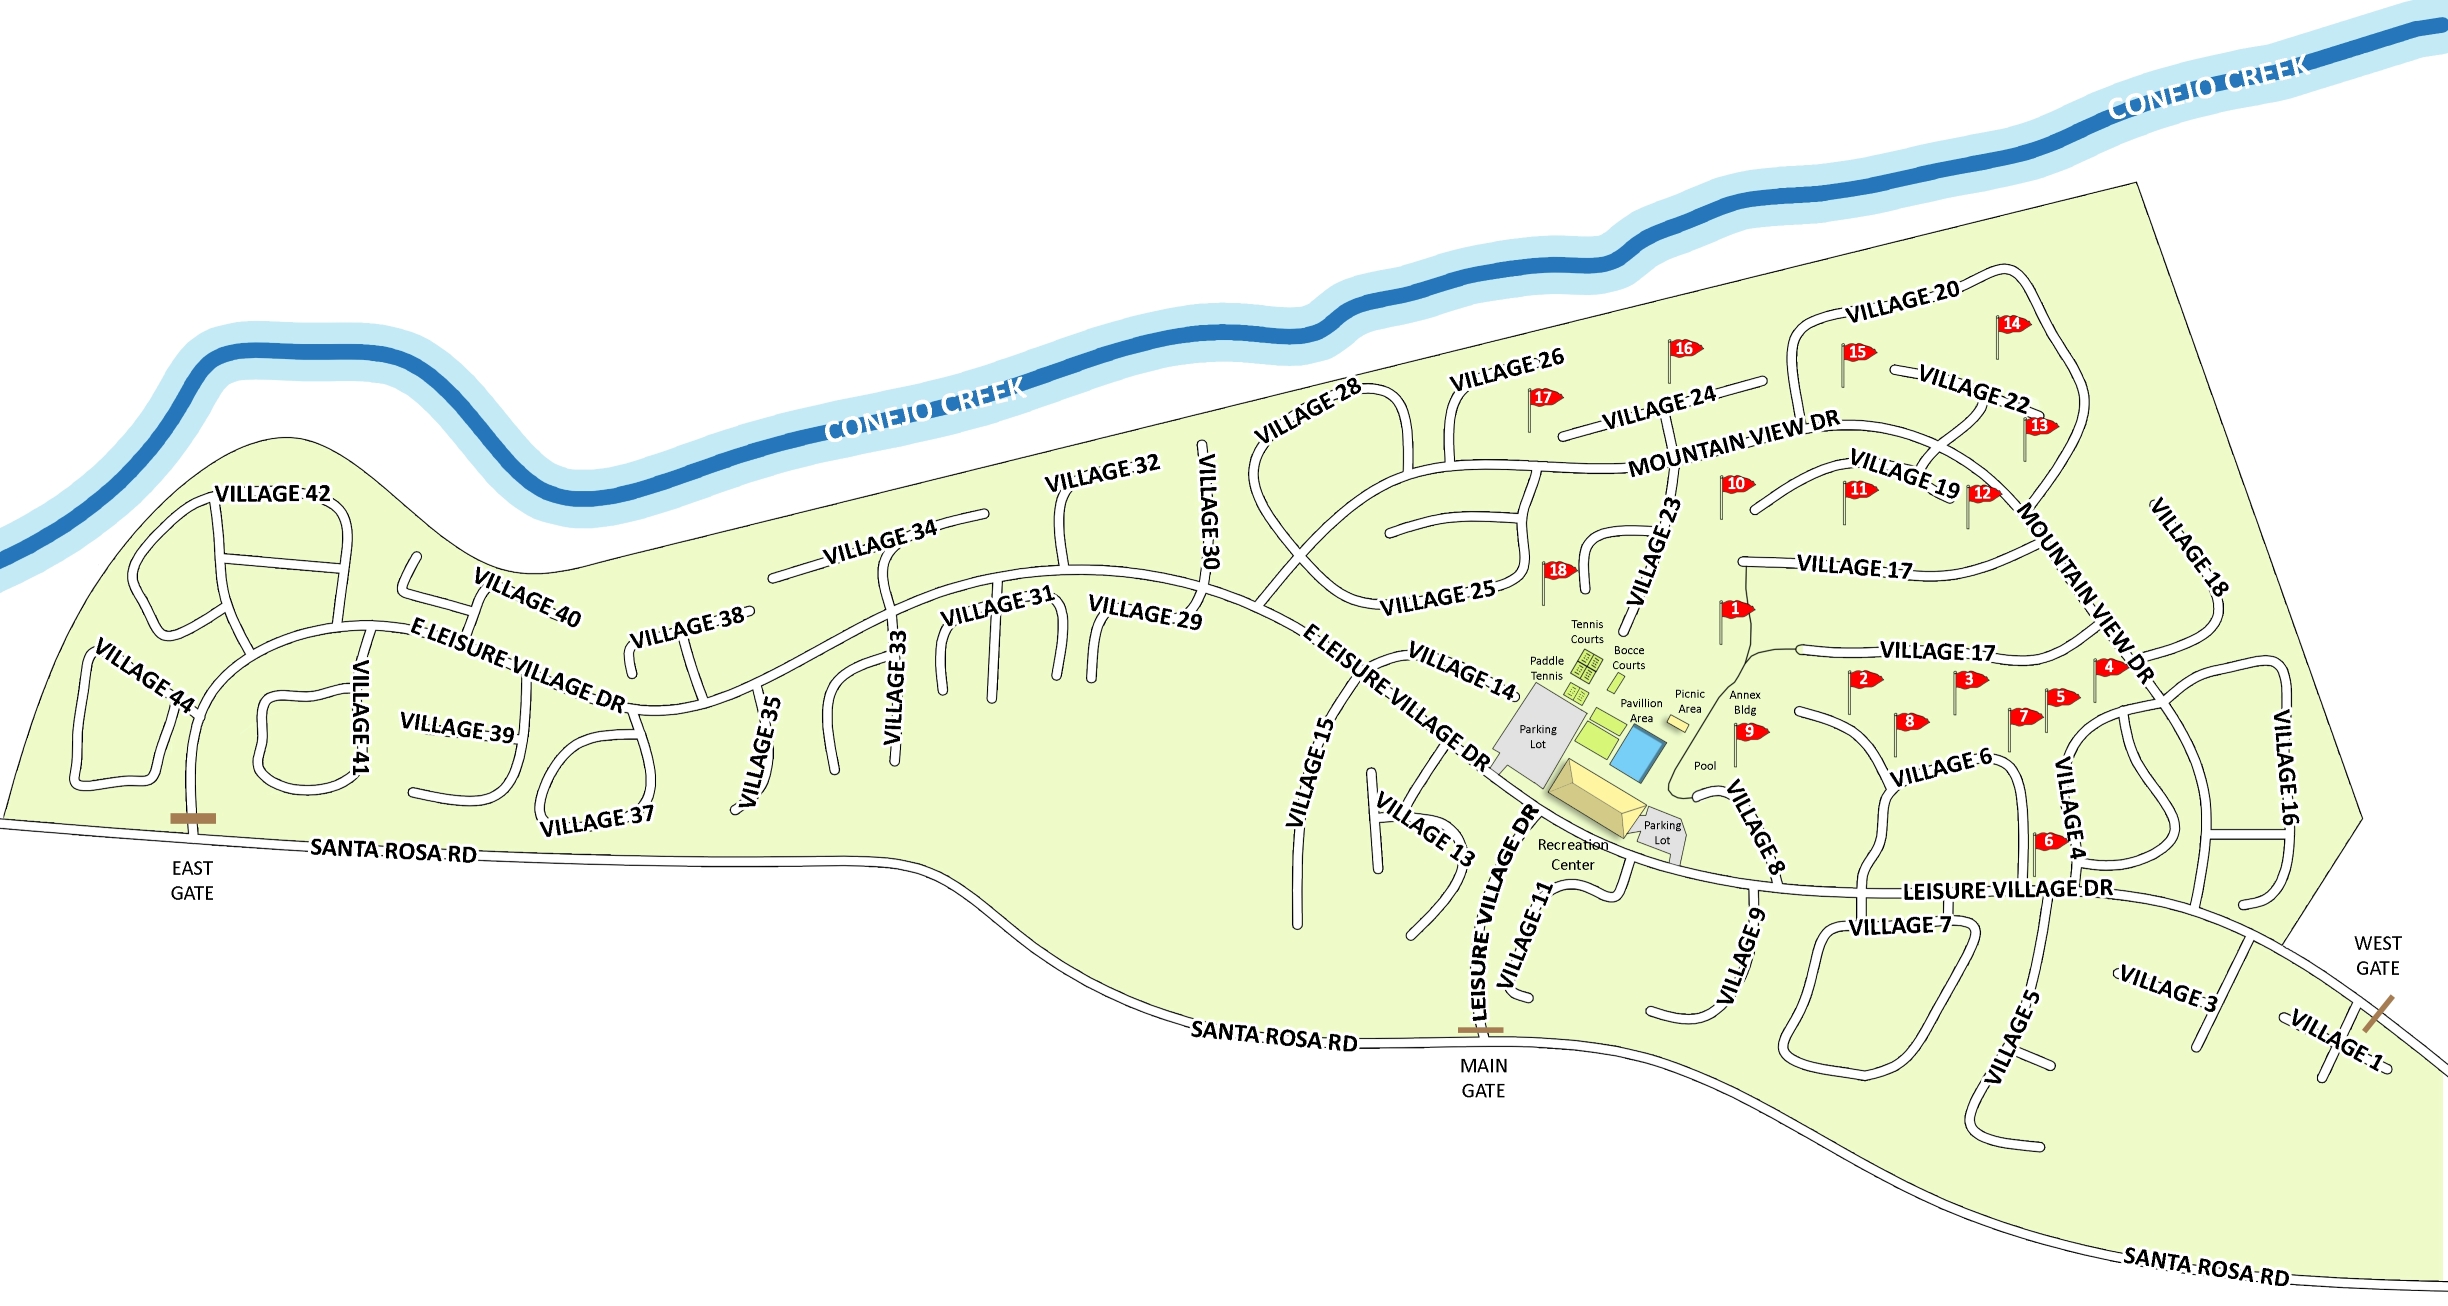
Leisure Village is an Active Senior Community for residents 55 & over in Camarillo California, where the weather is one of the best climates in the U.S. averaging 72 degrees. It is located on over 400 acres in a peaceful, park-like setting.
The security at Leisure Village includes 24-Hour Guard-Gated entry with 3 gates and patrol cars. All security personnel are trained in emergency First Aid.
The many amenities that residents enjoy include an 18-hole Golf Course, Fitness Center, Tennis & Pickle Ball Courts, Year-Round Heated Swimming Pool & Spa, Walking & Bicycle Paths, Woodshop, Ceramics Shop, Billiards, Farmer’s Garden, RV Parking and so much more!
The HOA monthly fee includes water, trash, sewer, Spectrum cable TV and internet, landscaping, exterior maintenance of homes and greenbelt areas, master insurance policy for homes’ exteriors and common areas. Residents pay their own electricity bill; some homes have solar.
There are 2136 homes with 16 different models. (floorplans link) They are all one-story with either 1 or 2 bedrooms. Some of the homes have a den and/or a formal dining room. The square footage of each unit ranges from 866 to 1829, although some people enclose their patios adding additional square footage. Most are duplexes, triplexes, and some fourplexes, although there are a handful of stand-alone units. Commons walls were built with an “airspace” between units, so you do not hear one another. Most of the homes in Leisure Village have a 1-car garage, but there are some 2-car garages (Valencia & La Jolla models and some Coronado models) and some carports. The homes were built between 1977 and 1982. They were not built with patio covers, fences or rain gutters, although many owners have added them over the years.
Many of the homes in Leisure Village are in a flood zone. If a homeowner is getting a loan, their lender will most likely require flood insurance in addition to a homeowners HO6 policy. Prior to Hurricane Katrina, Leisure Village was not in the flood zone.
Leisure Village homes have either 1 or 2 car garages or carports. You can park your car in your garage, in your driveway or on the street. If you have an over sized vehicle (boat, trailer, camper, RV), there is a 4 acre, gated site in Leisure Village with a wash rack that you may use at no additional charge if there is space.
Leisure Village Communication comes in multiple ways: LeisureVillage.org website with resident log-in for account info, Village Voice, Inside Leisure Village newspaper, LVTV Spectrum Channel 1390, flyers/posters in the Recreation Center (electronic and bulletin boards) and LV eNews.


Why Work with Us When You’re Ready to Buy/Sell in Leisure Village
-
- 20+ Years Real Estate Experience
- Leisure Village Homeowner since 2000
- Senior Real Estate Specialist (SRES)
- Excellent relationship with Leisure Village Association staff & other Realtors
- Volunteer member of LVA Insurance, Landscape and Architectural Committees to keep up with changes
- Coordinate handyman repairs, upgrading & housecleaning
- Coordinate charity donations of furniture
- Give full tour of the facilities/amenities to prospective buyers
- Assist with any required permits for Camarillo & Leisure Village Association
- Knowledge of landscaping requirements
- Check the home inside and out regularly
- Wash down front and back of house & provide new doormat
- Give weekly agent showing feedback to seller
YOUR Leisure Village Realtor Team
This information is for your personal, non-commercial use and may not be used for any purpose other than to identify prospective properties you may be interested in purchasing. Display of MLS data is usually deemed reliable but is NOT guaranteed accurate by the MLS. Buyers are responsible for verifying the accuracy of all information and should investigate the data themselves or retain appropriate professionals. Information from sources other than the Listing Agent may have been included in the MLS data. Unless otherwise specified in writing, Broker/Agent has not and will not verify any information obtained from other sources. The Broker/Agent providing the information contained herein may or may not have been the Listing and/or Selling Agent.
![]()
![]()
![]()


